The Doji and the Hammer

The first “candlestick” patterns, I teach are always, the hammer and doji.
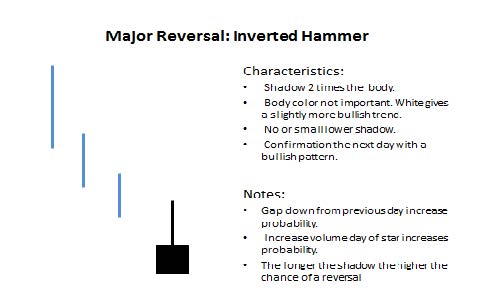
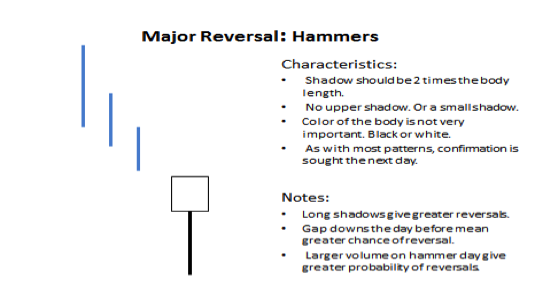
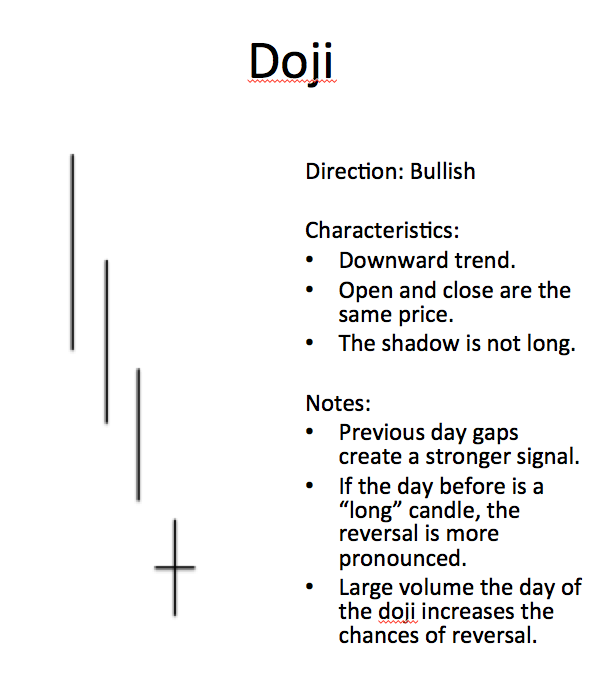
Find below, my cheat Flash Card for the hammer and the doji. It gives u a little more detail about the pattern. But basically the hammer and doji are a sign of reversal. Lets take a look at three possible scenarios. Down, Up and Sideways.
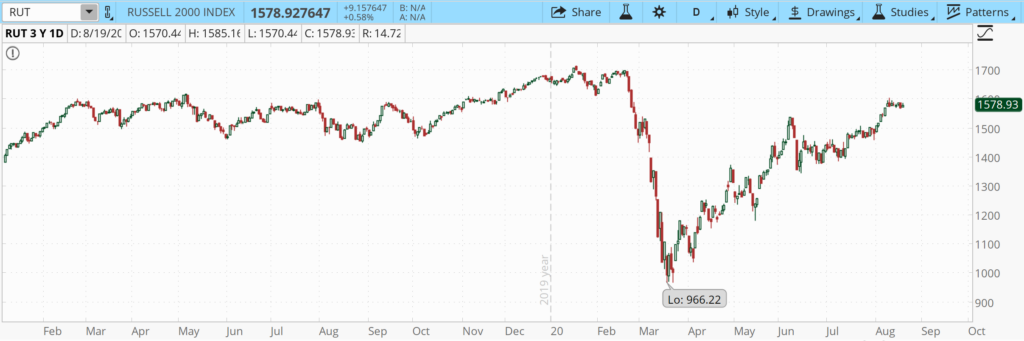
Downtrend. If the market is moving down, and we see a hammer or a doji, that is usually a sign of reversal. See below a couple examples.
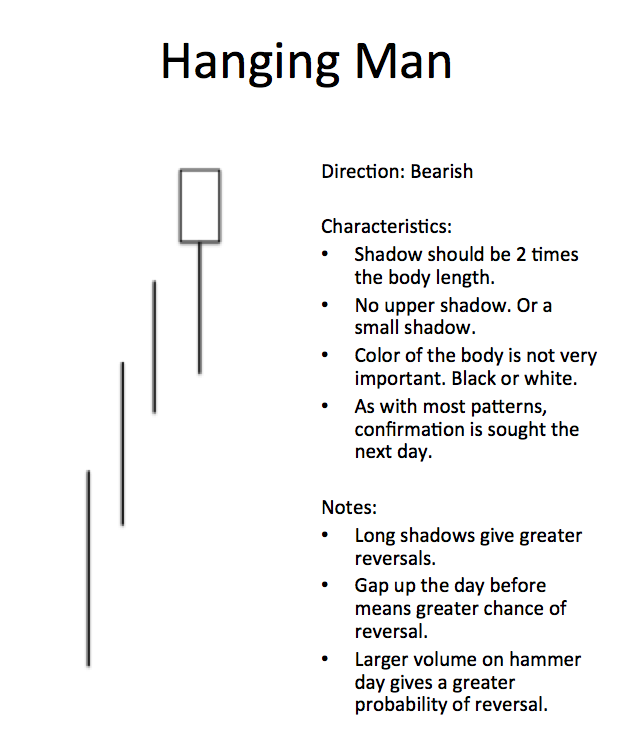
Uptrend. The opposite is true for uptrends. Generally speaking the market will reverse, if after an uptrend, there is a hammer or a doji pattern. See below.
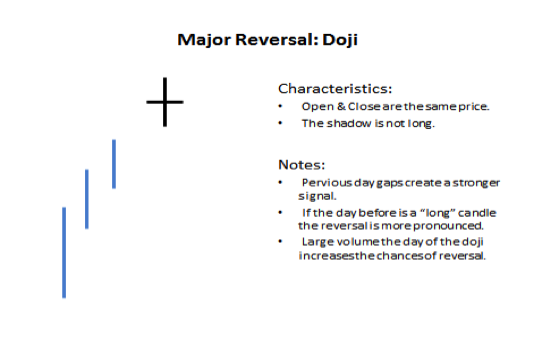
Now this is not absolute, but a general sign of reversal. There are all kinds of subtle, things you should watch for: volume, where the Doji or hammer happens (position relative to support and resistance, and the last candlestick). Thats a little more advanced conversation. For another day.
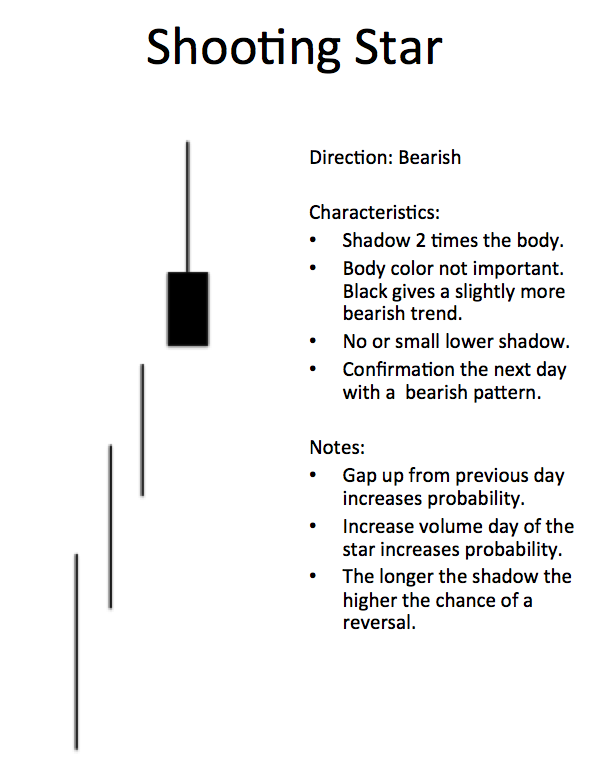
One other thing, you should notice about the Doji and the hammer, is they are often a sign of reversal and or in decision. The market has bear pressure and bull pressure. Therefore the tail (shadow) often demonstrates this pressure. Look at the shooting cross above, the long downward tail, tells us the bulls are losing, and the bears are winning.
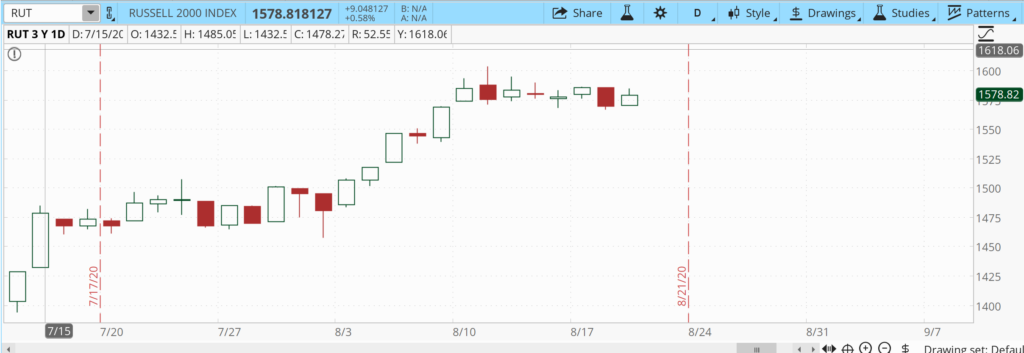
This also, leads to a discussion about the “Flag” charting pattern. Flags are hesitation, sideways action in the market. OFTEN, the sideways, action is a series of Doji and Hammer patterns. No one really winning. That is the perfect time for a FLAG trade. By the way, is that happing NOW? 🙂
See below.