January Barometer

The January Barometer, has been fairly accurate since 1950. A tremendous history of correlation, and hint as to future direction.
Basically, the J.B. has 2 parts.
First, if you look at the first 5 days of trading in January, it will give you a STRONG bias as to the this years direction for the over stock market. With about a 85% plus correlation. If the market goes up in the first 5 days of trading, the market will be up for the year. If it goes sideways, then the whole year will generally go sideways. If down, then 85% plus, the market will be down.
The second part of the J.B., is what happens in the whole month of JAN. If the market goes up in the first month of trading, the market will be up for the year. If it goes sideways, then the whole year will generally go sideways. If down, then 90% plus, the market will be down.
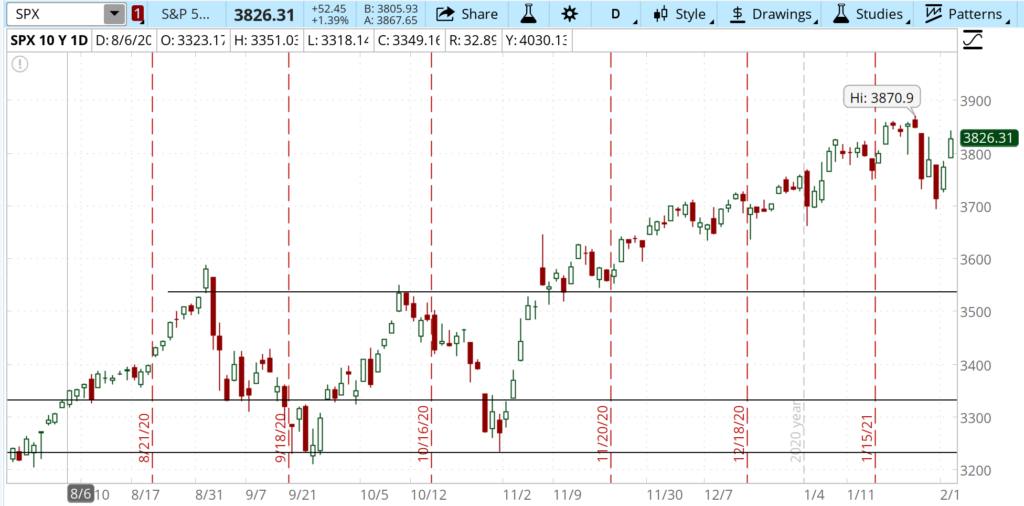
When I say look at the market. The data, correlation, is tied to the S & P 500. Or the SPX symbol.
Therefore, by looking in January what is going on (Direction) we can anticipate what the market is going to do for the year. If we have a general idea of the market direction, we can plan specific strategies, for the year. Certain strategies, work best in certain market conditions. A few examples below:
Market up?
- Buy equities or index. Simple strategy Buy the SPX, SPY directly. and hold.
- Dogs of the dow. A great strategy, around (data) since 1973. Even stronger combined with J.B.
- Buy calls on stocks, etf, or index. Playing the UP.
- Sell a VPUT. Regular.
- Sell Covered Calls, on stock, index or etf. An up strategy.
Market Sideways?
- Covered Calls. A sideways strategy.
- Sell VCalls and VPuts. Iron condor.
Market Down?
- Sell equities or index. Simple strategy Sell the SPX, SPY directly. Shorting.
- Buy puts on stocks, etf, or index. Playing the UP.
- Sell VCALLs.
Just a few, not all strategies, lots more to learn. If you want to learn more about trading. Visit.
http://www.creditspreadsystem.com
PS: First 5 days it went up. Opened at 3764.61 closed 5 days later at 3824.68 indicating an up year. After one full month. Closed at 3714.24. Therefore, the whole month of January, it went DOWN! Suggests, 2021 will be a down year, with about a past correlation of 90% or greater.