200 50 Day Moving Average
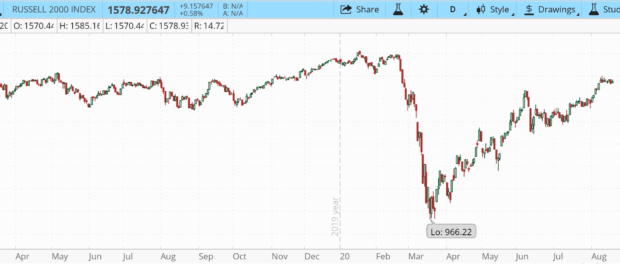
The major technical indicator in the Market is the 200 and 50 day moving average. If the stock or index is going up (prices), and it crosses, generally that is considered negative (the death cross). The death of the stock or index.
If the after a down trend, which we had in Feb and Mar, it cross toward the bottom, and or on the way up, it is considered the holly cross. The stock or index is positive.
Well recently, last couple days, the average crossed, indicating the market is on an uptrend. And hopefully, continues up.
But a word of caution. Usually, when the cross happens on the down, or up side, it moves back and forth. As the short term price and average moves up and down. So, we really will not see, a true “Cross” for a few weeks.
But it is a positive sign, in the market.
PS: My bigger concern with the market is the election coming up. I am not political, however, both candidates have differing opinions on the FREE market system. Trump is generally PRO market, Biden, in favor of restrictions, and government intervention. So. likely (no prediction), if trump wins the market will respond favorable, if Biden wins, it will be cautious, or down. There could be some big moves, in November. Trying to figure out, what strategies, to play. Perhaps a Saddle, Strangle, or Day Futures. 🙂

