Day 45 Sept Credit Spread Trades

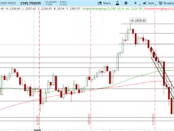
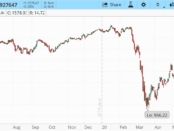
Some notes: Charting Was flagging. Broke the bottom of the flag. So as expected dropped. Mini Support and resistance at 2100 and 2130. Major Support and resistance, 2100, 2000, 1950. 20/5 moving average is still bullish, but the candle stick has broken, both lines, so will move to bearish, shortly. if still down next couple days. Remember MA is lagging indicator. Price moves first, average later. 200/50 MA is still bullish. Double top pattern. Already broke the neck line so u would expect a drop. which it did. Candlestick is a sort of hammer, [Read More Now...]